Ontology Explorer
The Ontology Explorer page enables users to create, edit, consolidate, and expose data concepts with business terminology. The data model serves as an ontology that allows integrating datasets as business concepts with semantic relationships, hierarchies of classifications, hard-coded business rules, and calculated metrics while consolidating data from multiple sources into a single semantic layer. The Ontology Explorer is used by both editors and viewers and is equipped with granular access controls, a full version control functionality to easily roll back and edit the data model, and search functionality of meta-data and relationships across the model to enable easy and intuitive data discovery and exploration.
Ontology Explorer Page
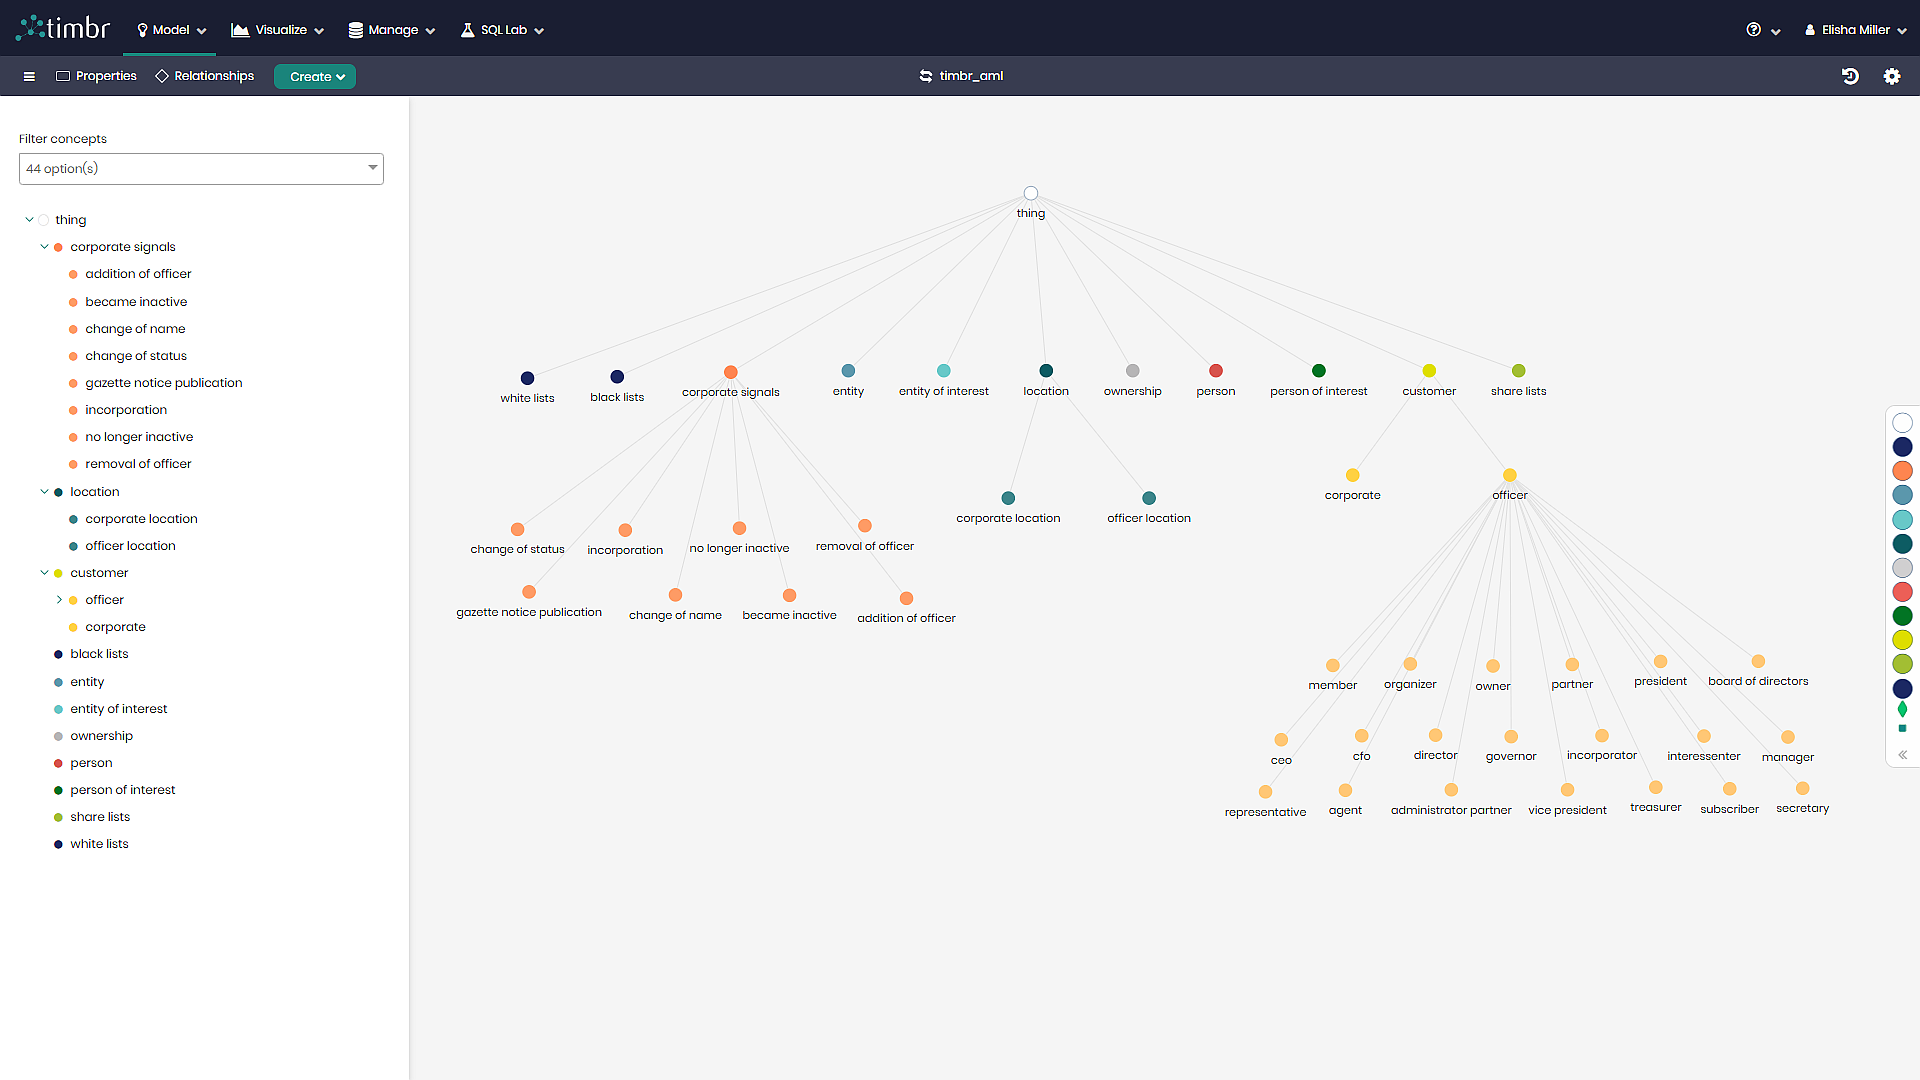
Timbr's Ontology Explorer page can be accessed through the Model tab by clicking on Ontology Explorer and selecting the desired knowledge graph.
The ontology explorer consists of different sections to explore the ontology graph:
Ontology Tree - A list of concepts and options to filter the graph and get more information about a certain concept.
Graph Viewer - An interactive graph representing the ontology.
Main Graph Control - A list of control options for the graph. It can be accessed above the Ontology.
Concept Menu - A list of actions that can be performed on a single concept. It can be accessed by right-clicking on a concept.
Concept Details - A right-side panel that opens up when you click on a concept in the graph. Provides additional information about a concept.
The Concepts Tree
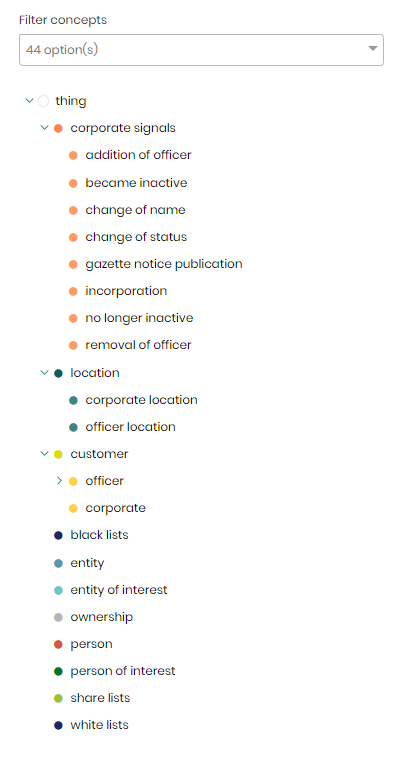
In this section, you can see the hierarchy of the concepts in your ontology and you have the option to filter or get more information about a concept in the graph.
Graph Viewer
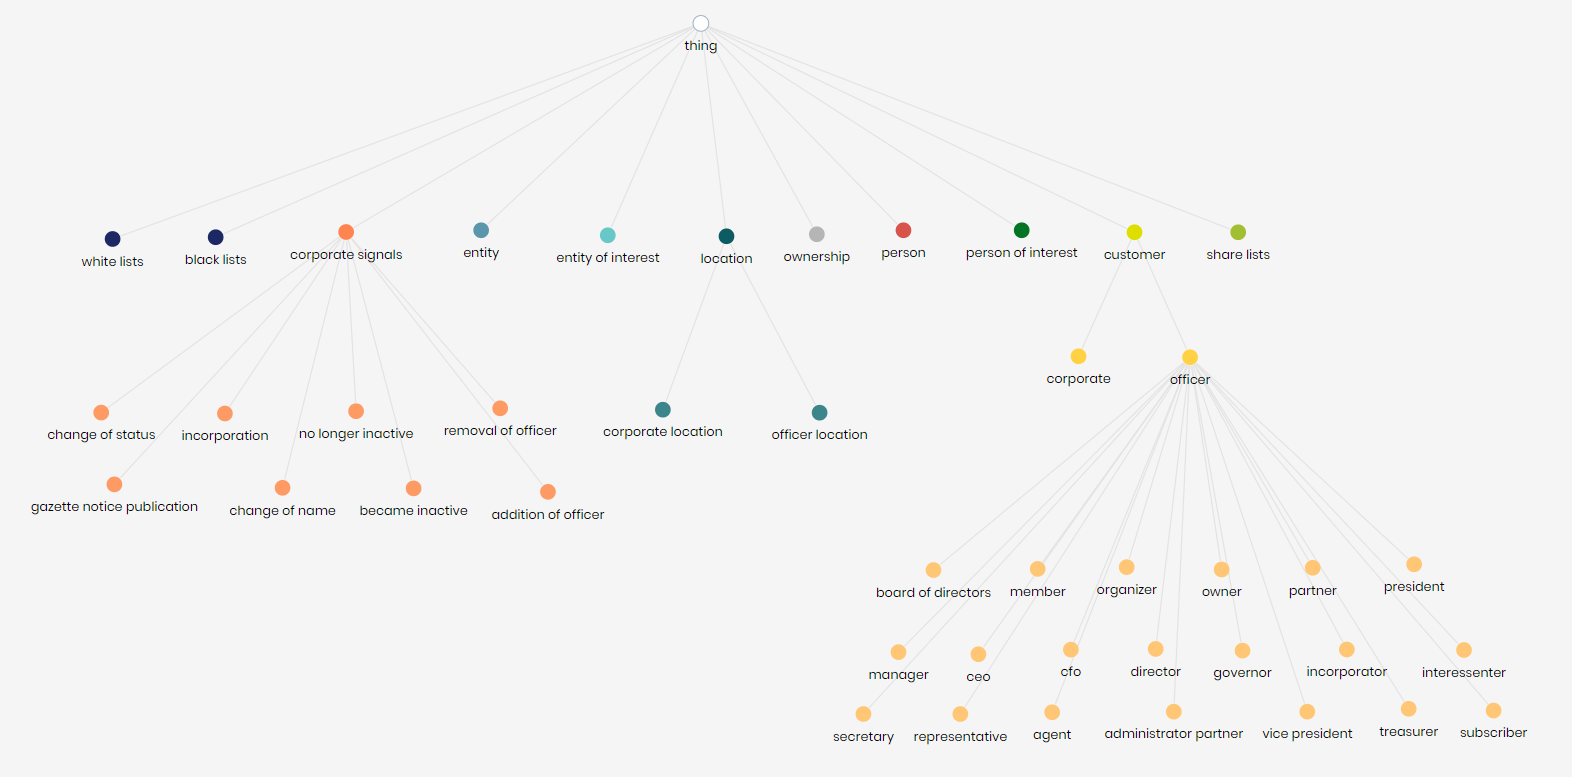
An interactive graph representing your ontology. The graph can be filtered to show the properties and references each individual concept has. More information on how to control the graph can be found in the next section below.
You can zoom-in and zoom-out of the graph view by using the mouse wheel.
Main Graph Control
![]()
The graph controls above the ontology explorer control the behavior and presentation of the graph. The following options are available:
Horizontal Bars - Opens a small dropdown menu with the options to:
- Save the current exploration.
- Open a saved exploration.
- Enter the current ontologies performance dashboard.
Properties - Opens a menu to indicate which properties to show on the graph, with the following options:
- Show all - A toggle to show all the properties in the graph.
- Filter box - A filter box for selecting specific properties to be displayed on the graph.
- Filter current graph - Filters the concepts on the current graph to only show the concepts and their connected concepts that contain the selected properties.
- Add to current graph - Adds the selected properties to the relevant concepts, leaving the other concepts on the graph untouched.
- New graph - Renders a new graph showing only the direct concepts that contain the selected properties.
Relationships - Opens a menu to indicate which relationships to show on the graph, with the following options:
- Show all - A toggle to show all the relationships in the graph.
- Filter box - A filter box for selecting specific relationships to be displayed on the graph.
- Filter current graph - Filters the concepts on the current graph to only show the concepts and their connected concepts that contain the selected relationships.
- Add to current graph - Adds the selected relationships to the relevant concepts, leaving the other concepts on the graph untouched.
- New graph - Renders a new graph showing only the direct concepts that contain the selected relationships.
Create - Opens a small dropdown menu with the options to:
- Create a new concept.
- Create one or more concepts using an existing concepts properties.
- Create a new property to assign to an existing concept.
- Create a new concept data mapping.
Change Knowledge Graph - Opens a dropdown with all the available knowledge graphs to select from and transfer to.
Cached Resources - Opens a window with all the cached resources connected to the current knowledge graph.
Ontology History - Opens a window containing details on all the actions performed on the current Ontology, with the ability to undo previous actions.
Graph Settings - Opens a settings window with the following options:
- Node Sizing - Allows changing the sizing of the concept nodes on the graph.
- Node coloring - Allows changing the colors of the concept nodes on the graph based on different methods such as by Inheritance level, Branches and leaves, Mapped and unmapped concepts, etc.
- Arrange graph - Makes nodes on the graph automatically return to the default position.
- Auto arrange toggle - When the toggle is switched on, concept nodes on the graph will automatically rearrange after each action. When the toggle is switched off, concept nodes on the graph will remain unmoved.
- Extended view - When the toggle is switched on, the extended view of the entire ontology will be presented. When the toggle is switched off, only the top first layer of concept nodes will be represented on the graph without their children concepts.
- Node description - When the toggle is switched on, concept node descriptions will appear when hovering over the concept. When the toggle is switched off, concept node descriptions will no longer appear when hovering over the concept.
- Highlight graph - When the toggle is switched on, concept nodes and their edges will appear highlighted when hovering over the concepts or their edges. When the toggle is switched off, concept nodes and their edges will no longer appear highlighted when hovering over the concepts or their edges.
- Horizontal layout - When the toggle is switched on, the graph will be presented in a horizontal layout. When the toggle is switched off, the graph will return to the normal default layout.
- Legacy layout - When the toggle is switched on, the graph will be presented using a legacy algorithm layout. When the toggle is switched off, the graph will return to the normal default layout.
Concept Menu
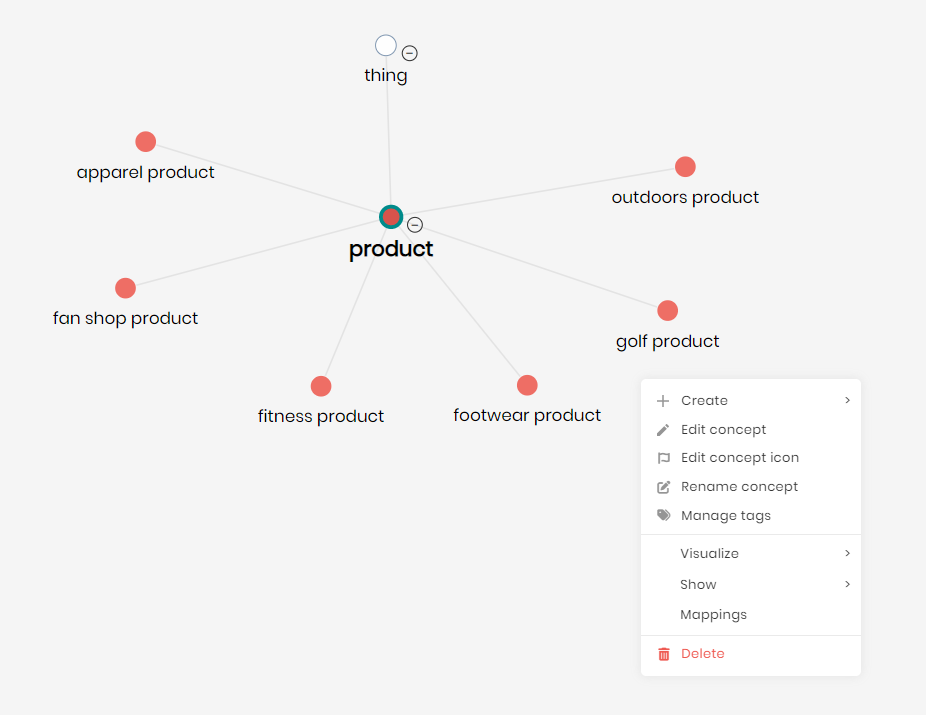
When you right-click on a concept in the graph viewer, a menu will open with actions that correspond to the concept.
Create - When hovering over Create the following options will appear:
- Create a child concept for the selected concept.
- Create one or more concepts using the selected concepts existing properties.
Edit concept - Opens an edit concept window in order to edit all aspects of the selected concept. This includes editing the concept’s primary key, entity label, properties, relationship, business logic, etc.
Edit concept icon - Opens a window in order to choose a custom icon to represent the selected concept.
Rename concept - Opens a window in order to rename the selected concept.
Manage tags - Opens a window in order to add or edit the tags of the selected concept.
Visualize - When hovering over Visualize the following options will appear:
- Visualize as chart - Opens Timbr’s built-in BI module in order to visualize the selected concept’s underlying data using charts and graphs.
- Explore as graph - Opens Timbr’s Graph Explorer module in order to visualize the selected concept’s underlying data as nodes on a graph.
- View lineage - Opens a window with the selected concept’s data lineage, showing its connected data sources, tables, data mappings, views and other concepts in the hierarchy.
- Fetch Sample Data - Retrieves a sample of 50 rows of data for the selected concept. The data retrieved does not include any graph traversal and is used just for plain data exploration.
Show - When hovering over Show the following options will appear:
- Expand/Collapse child concepts - Choosing to expand a concept will expand and present the child concepts, whereas choosing to collapse a concept will collapse and hide the child concepts.
- Show relationships - Presents all the chosen concept’s relationships with other concepts on the graph.
- Show properties - Presents all the chosen concept’s properties on the graph.
- Filter graph - Filters the graph presenting only the chosen concept and its hierarchy.
- Information - Opens the concept details menu on the right side of the screen, showing a detailed summary of the selected concept.
Mappings - Opens a window that enables the mapping of data to the chosen concept in a few simple steps.
Delete - When clicked the chosen concept will be deleted from the Ontology model.
Concept Details
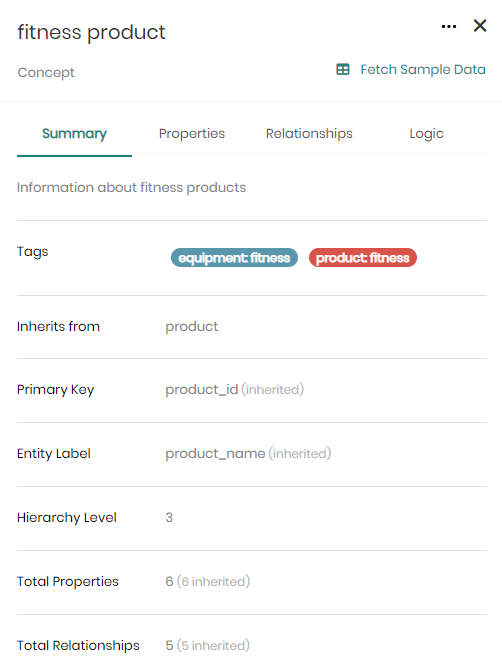
This menu opens from the right-side of the screen when you click on a concept in the graph. The menu shows a detailed summary for the selected concept, and includes:
Fetch Sample Data - Retrieves a sample of 50 rows of data for the selected concept. The data retrieved does not include any graph traversal and is used just for plain data exploration.
Summary Tab
Description - Presents the concept’s description.
Tags - Presents the tags given to the chosen concept.
Inherits from - Presents the concept the chosen concept inherits from.
Primary Key - The primary key of the concept.
Entity Label - The entity label of the concept, where there can be one or multiple entity labels.
Hierarchy Level - The hierarchy level of the concept in the ontology.
Total Properties - How many properties (direct and inherited) are in the concept.
Total Relationships - How many relationships (direct and inherited) are in the concept.
Properties Tab
Inherited Properties - A list of the concept’s inherited properties with their name and type if any exist.
Direct Properties - A list of the concept’s direct properties with their name and type if any exist.
Relationships Tab
Inherited Properties - A list of the concept’s inherited relationships including the relationship name and the concept the relationship is connected to if any exist.
Direct Properties - A list of the concept’s direct relationships including the relationship name and the concept the relationship is connected to if any exist.
Logic Tab
For concepts that contain predefined business logic, the logic will be presented as an SQL statement in the logic tab.